Monitoring using Prometheus Operator#
You can install the Prometheus Operator in the Kubernetes Cluster, configure it to scrape an endpoint. In this guide we walk through the steps to configure the prometheus Operator for scraping metrics from the config-server.
this guide is not a production deployment guide but rather a guide to help you getting started in the lab
Install the prometheus operator#
Install Prometheus Operator into the Kubernetes Cluster. This includes all of Prometheus Operator’s Kubernetes custom resource definitions (CRDs) that define the Prometheus, and ServiceMonitor abstractions used to configure the monitoring stack.
this instruction deploys the prometheus operator in the default namespace. To install in another namespace refer to prometheus Operator
Install the Operator using the bundle.yaml file in the Prometheus Operator GitHub repository:
kubectl create -f https://raw.githubusercontent.com/prometheus-operator/prometheus-operator/master/bundle.yaml
You should see the following output:
customresourcedefinition.apiextensions.k8s.io/alertmanagerconfigs.monitoring.coreos.com created
customresourcedefinition.apiextensions.k8s.io/alertmanagers.monitoring.coreos.com created
customresourcedefinition.apiextensions.k8s.io/podmonitors.monitoring.coreos.com created
customresourcedefinition.apiextensions.k8s.io/probes.monitoring.coreos.com created
customresourcedefinition.apiextensions.k8s.io/prometheuses.monitoring.coreos.com created
customresourcedefinition.apiextensions.k8s.io/prometheusrules.monitoring.coreos.com created
customresourcedefinition.apiextensions.k8s.io/servicemonitors.monitoring.coreos.com created
customresourcedefinition.apiextensions.k8s.io/thanosrulers.monitoring.coreos.com created
clusterrolebinding.rbac.authorization.k8s.io/prometheus-operator created
clusterrole.rbac.authorization.k8s.io/prometheus-operator created
deployment.apps/prometheus-operator created
serviceaccount/prometheus-operator created
service/prometheus-operator created
Verify that the installation succeeded
Configure the Prometheus Operator#
Create a monitoring namespace
Create RBAC permissions
kubectl apply -f - <<EOF
apiVersion: v1
kind: ServiceAccount
metadata:
  name: prometheus
  namespace: monitoring
EOF
kubectl apply -f - <<EOF
apiVersion: rbac.authorization.k8s.io/v1
kind: ClusterRole
metadata:
  name: prometheus
rules:
- apiGroups: [""]
  resources:
  - nodes
  - nodes/metrics
  - services
  - endpoints
  - pods
  verbs: ["get", "list", "watch"]
- apiGroups: [""]
  resources:
  - configmaps
  verbs: ["get"]
- apiGroups:
  - networking.k8s.io
  resources:
  - ingresses
  verbs: ["get", "list", "watch"]
- nonResourceURLs: ["/metrics"]
  verbs: ["get"]
EOF
kubectl apply -f - <<EOF
apiVersion: rbac.authorization.k8s.io/v1
kind: ClusterRoleBinding
metadata:
  name: prometheus
roleRef:
  apiGroup: rbac.authorization.k8s.io
  kind: ClusterRole
  name: prometheus
subjects:
- kind: ServiceAccount
  name: prometheus
  namespace: monitoring
EOF
Deploy Prometheus
kubectl apply -f - <<EOF
apiVersion: monitoring.coreos.com/v1
kind: Prometheus
metadata:
  name: prometheus
  namespace: monitoring
  labels:
    app: prometheus
spec:
  image: quay.io/prometheus/prometheus:v2.22.1
  nodeSelector:
    kubernetes.io/os: linux
  replicas: 2
  resources:
    requests:
      memory: 400Mi
  securityContext:
    fsGroup: 2000
    runAsNonRoot: true
    runAsUser: 1000
  serviceAccountName: prometheus
  version: v2.22.1
  serviceMonitorSelector: {}
  serviceMonitorNamespaceSelector: {}
EOF
Verify prometheus is running
Deploy the config-server service monitor#
Configure the service monitor that enables prometheus to scrape metrics from the config-server
kubectl apply -f - <<EOF
apiVersion: monitoring.coreos.com/v1
kind: ServiceMonitor
metadata:
  labels:
    app.kubernetes.io/name: config-server
  name: config-server-metrics-monitor
  namespace: network-system
spec:
  endpoints:
    - interval: 30s
      path: /metrics
      port: metrics # Ensure this is the name of the port that exposes HTTPS metrics
      scheme: https
      bearerTokenFile: /var/run/secrets/kubernetes.io/serviceaccount/token
      tlsConfig:
        # TODO(user): The option insecureSkipVerify: true is not recommended for production since it disables
        # certificate verification. This poses a significant security risk by making the system vulnerable to
        # man-in-the-middle attacks, where an attacker could intercept and manipulate the communication between
        # Prometheus and the monitored services. This could lead to unauthorized access to sensitive metrics data,
        # compromising the integrity and confidentiality of the information.
        # Please use the following options for secure configurations:
        # caFile: /etc/metrics-certs/ca.crt
        # certFile: /etc/metrics-certs/tls.crt
        # keyFile: /etc/metrics-certs/tls.key
        insecureSkipVerify: true
  selector:
    matchLabels:
      app.kubernetes.io/name: config-server
EOF
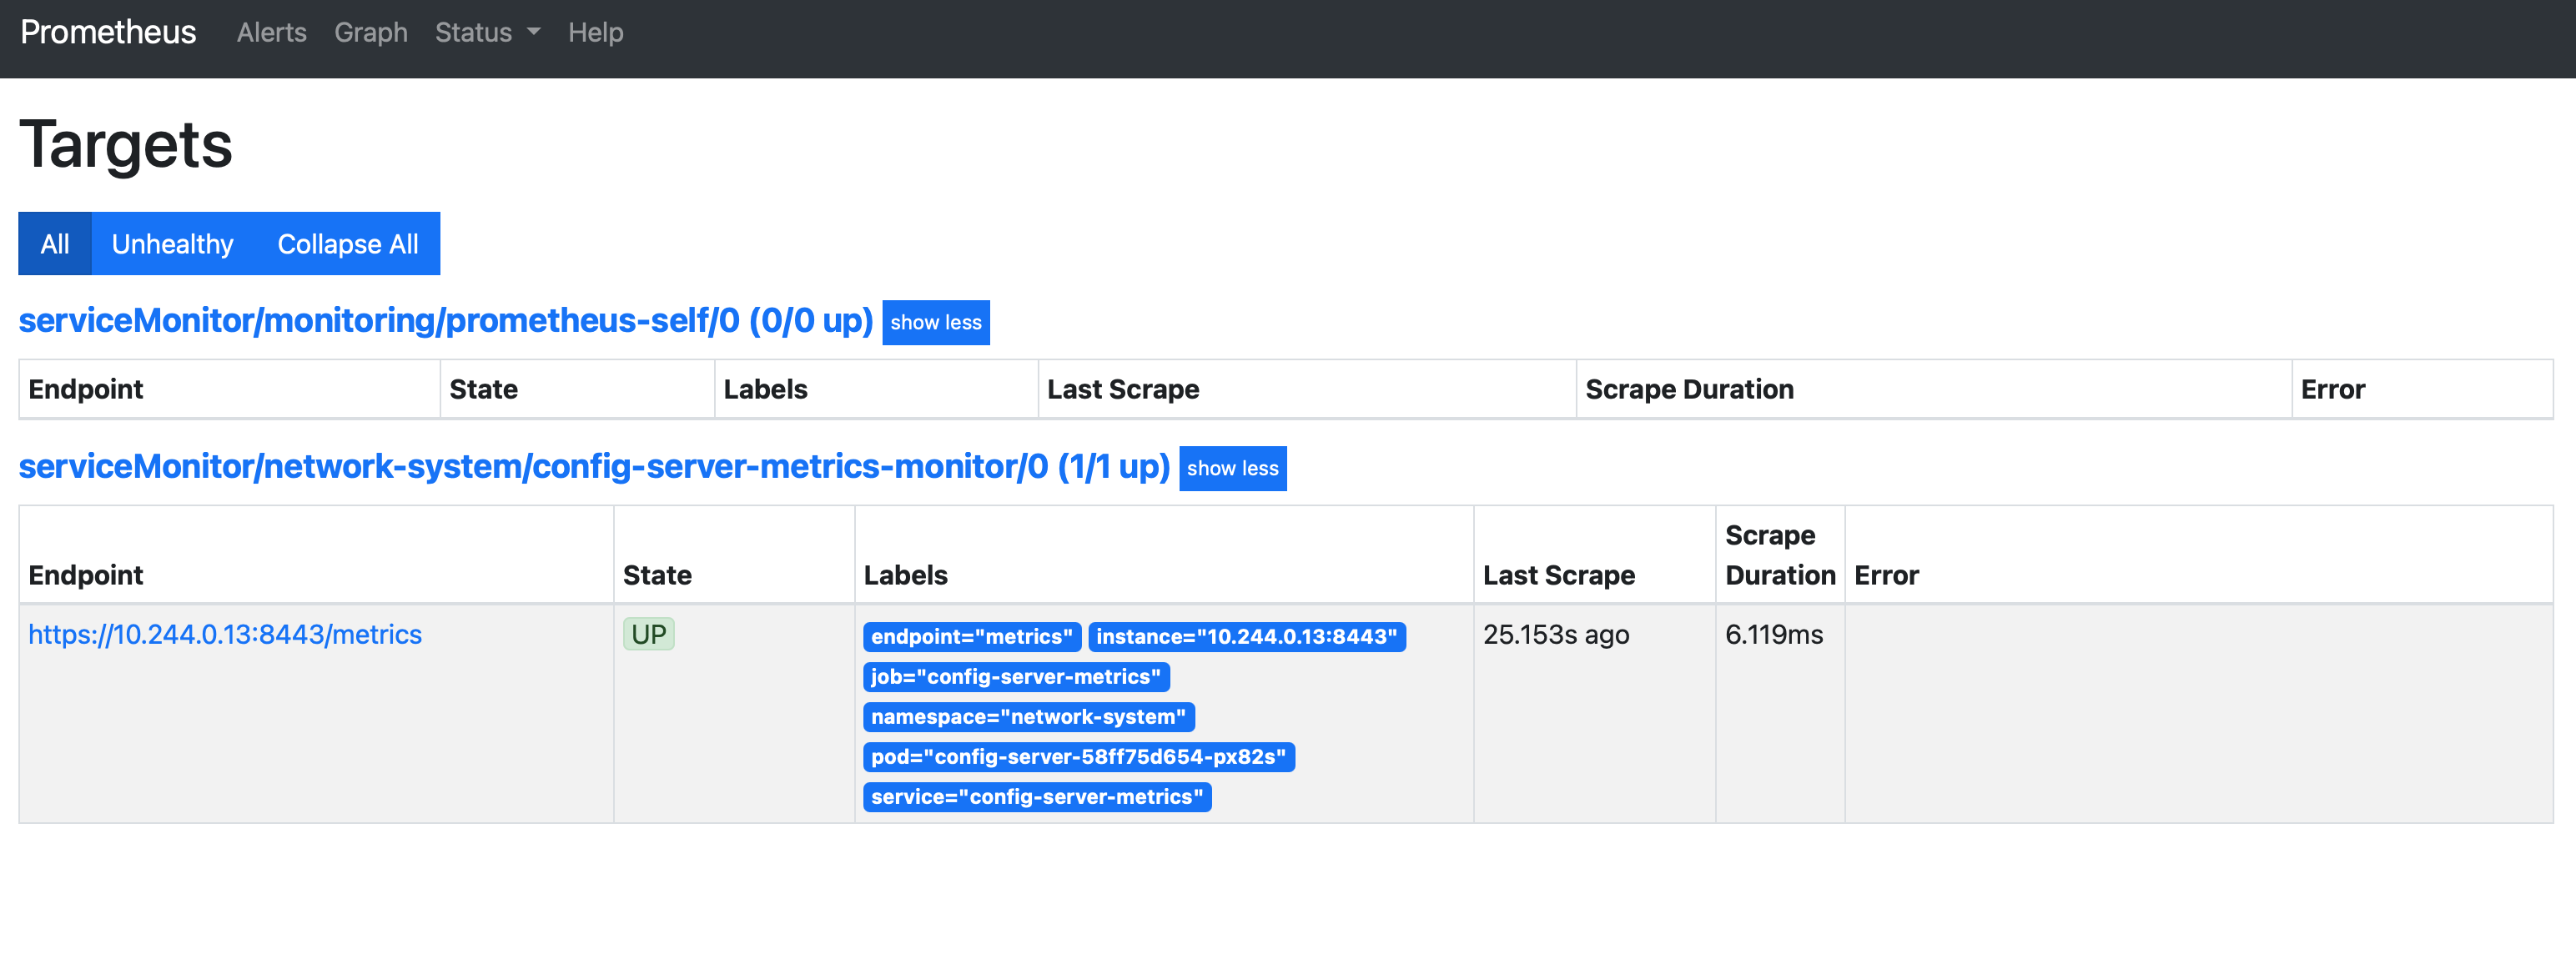
To verify the scraping works, login to the prometheus web service. We expose the prometheus server using port forwarding.
Navigate to http://localhost:9090 to access the Prometheus interface:
Click on Status, then Targets to see any configured scrape targets.

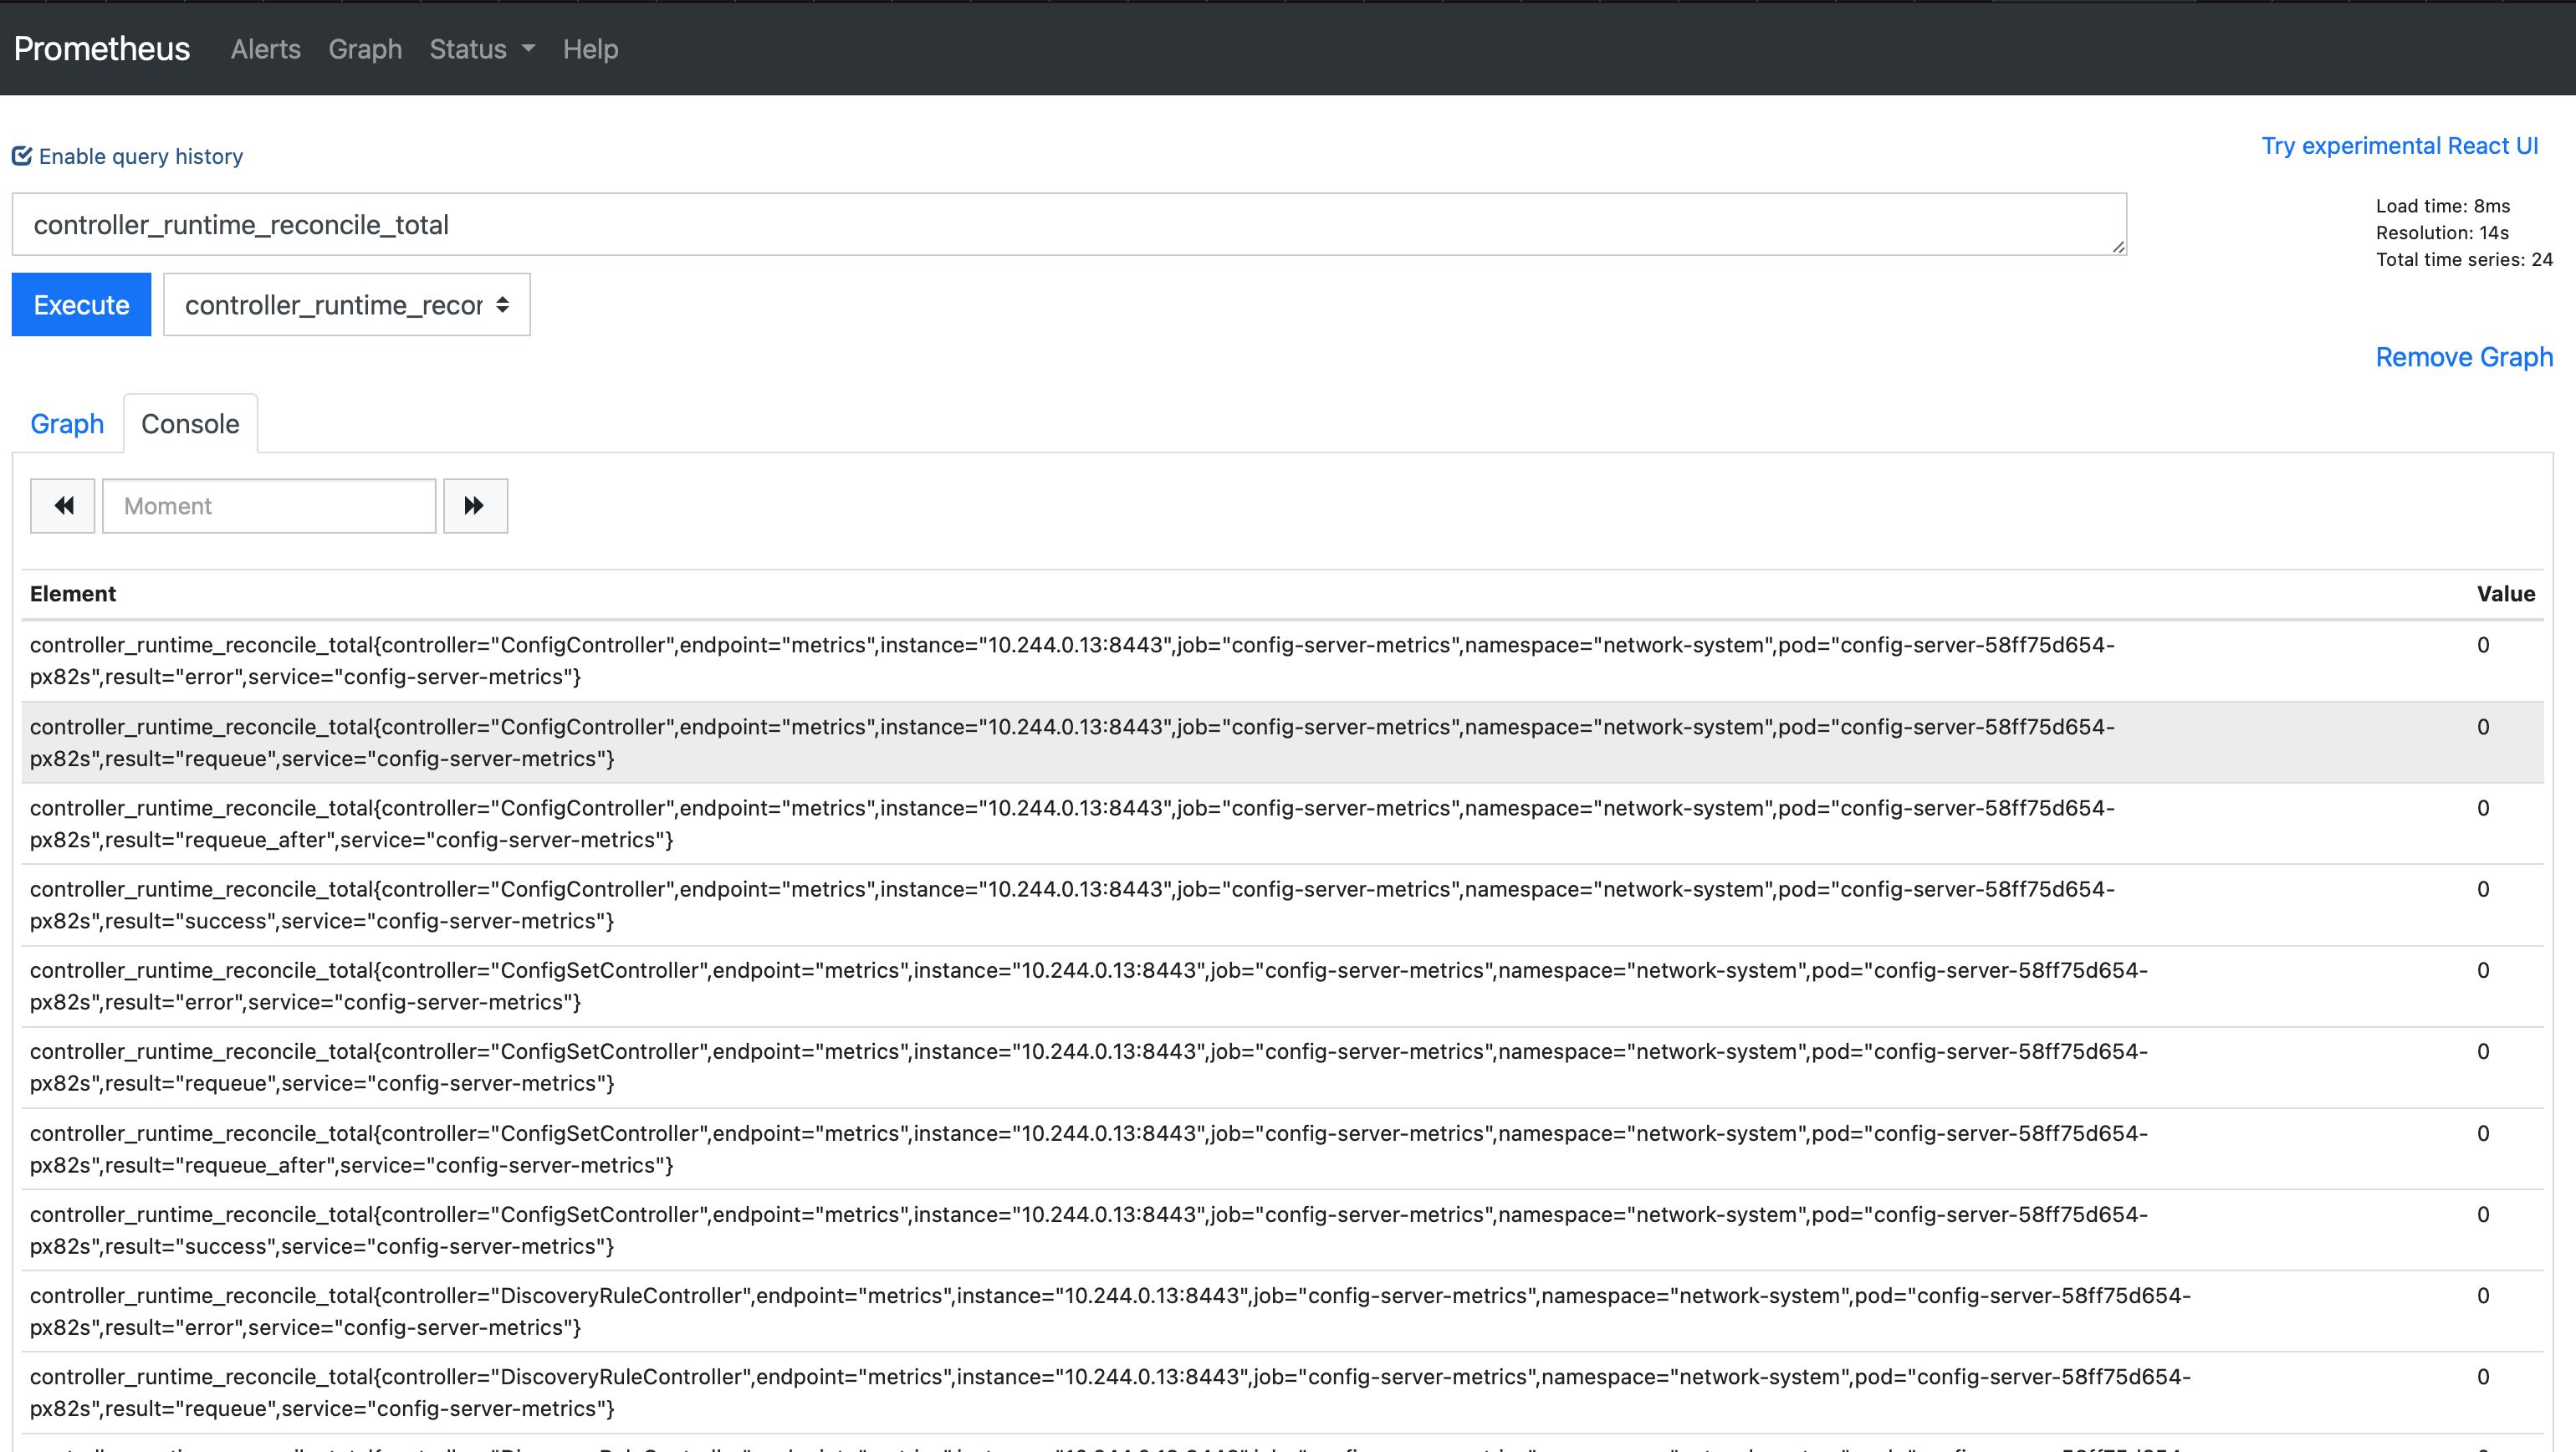
Navigate to Graph to test metrics collection:

In the Expression box, type controller_runtime_reconcile_total, and press ENTER.
Troublesheeting#
In case of trouble here is a link to the troubleshooting-guide